


 26 / 228

1. LVL AS A CONSTRUCTIONMATERIAL
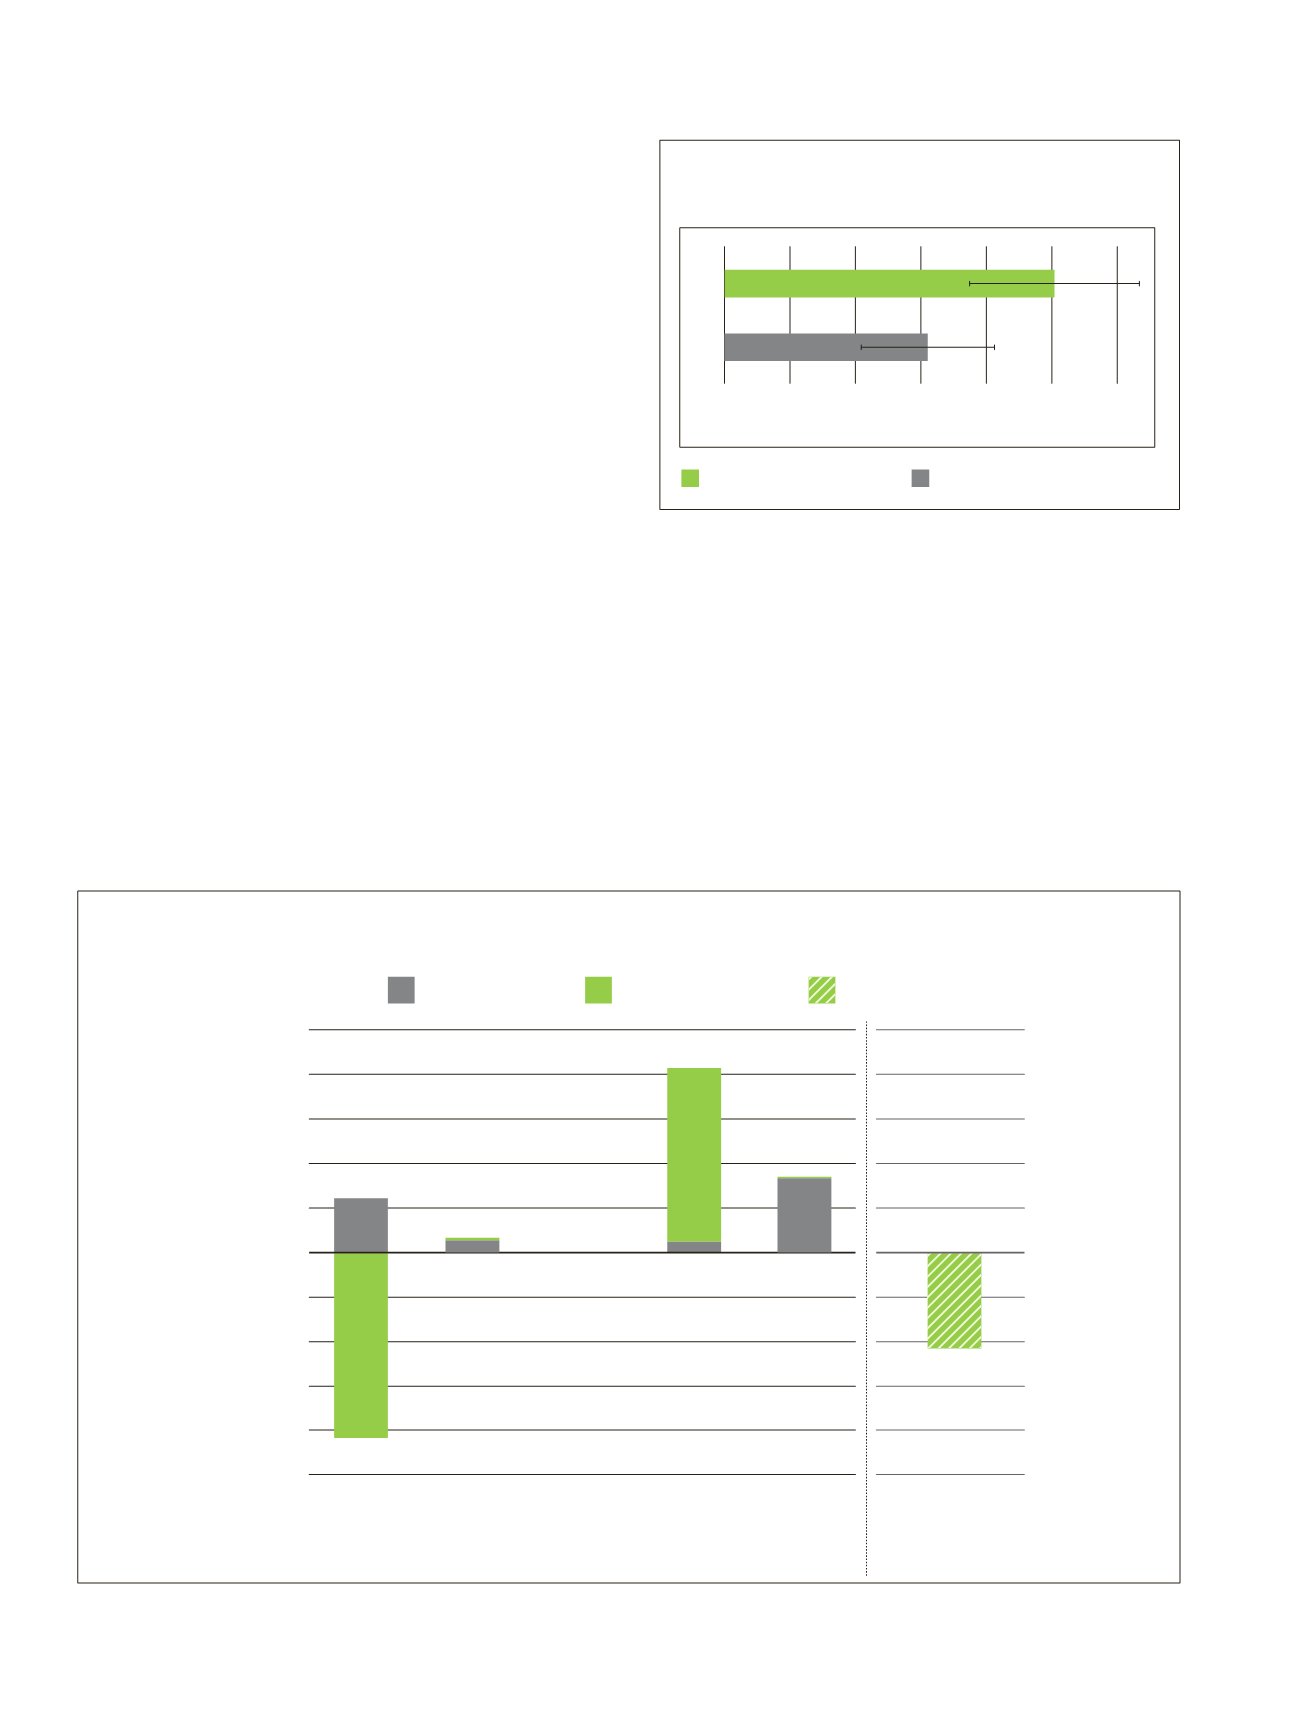
Figure 1.19.
Example global warming potential of different life cycle stages
3, 7, 8
.
1.5.3 Global Warming impact of LVL
In the manufacture of LVL, a large share of renewable energy
is used (see Figure 1.18), resulting in lower fossil greenhouse
gas emissions and global warming potential compared to oth-
er building materials. In addition, LVL stores biogenic carbon,
which constitutes about one half of the dry weight of the wood.
The biogenic carbon remains in the LVL throughout its lifetime
until it is released back to the atmosphere to be absorbed by the
next generation of growing trees.
The global warming potential of LVL when used in a
load-bearing structure of a building has been determined by
LVL producers as follows:
• Raw materials extraction and energy use are similar in dif-
ferent production units, but different energy mixes are used
depending on the unit and country. Energy mix affects the
greenhouse gas emissions of the production stage (modules
A1–3). Biogenic carbon content is given separately.
• Construction stage (A4–5) covers transportation to the Cen-
tral European market and normal construction works.
• Use stage (B1–7) is considered negligible.
• End of life stage C1–4 scenarios consider utilization of LVL
as a source of energy.
• Module D, other benefits, originate mainly from the bio-en-
ergy substitution effect, compared to typical local energy
mix, when LVL is used for bioenergy at end of life.
Figure 1.18
Primary energy (renewable and non-renewable) use in
the manufacturing stage (A1–A3) of LVL
3 ,7, 8
.
Biogenic Global Warming Potential is the sum of stored bio-
genic carbon in the production stage and release of biogenic
carbon in the end of life stage. The sum is close to zero for the
whole life cycle.
Consolidated results for fossil global warming potential
show that the production stage (A1–3) constitutes 90% of the
result (Figure 1.19). The construction stage (A4–5) constitutes
10%, and end of life stage (C1–4) constitutes 2.5% of the fossil
GWP. Inmodule D the GWP benefits are shown as the amount
of fossil fuels substituted by biomass energy.
USE OF RENEWABLE AND NON-RENEWABLE
PRIMARY ENERGY IN PRODUCTION STAGE
Renewable energy, PERE
Non-renewable energy, PENRE
0
1000
2000
3000
4000
5000
6000
Energy consumption [MJ/m³]
LVL 01, Figu e 1.16
• MUOKATTU 28.8.
GLOBALWARMING POTENTIAL (GWP) OF LVL (kg CO2 equiv./m3)
GWP fossil
GWP biogenic
GWP benefits
1000
800
600
400
200
0
-200
-400
-600
-800
-1000
A1-A3
Product stage
A4-A5
Construction
stage
B1-B7
Use stage
C1-C4
End of life
D
Loads and benefits
beyond system
boundary
Total
(module D
not included)
24
LVL Handbook Europe