



 22 / 228

1. LVL AS A CONSTRUCTIONMATERIAL
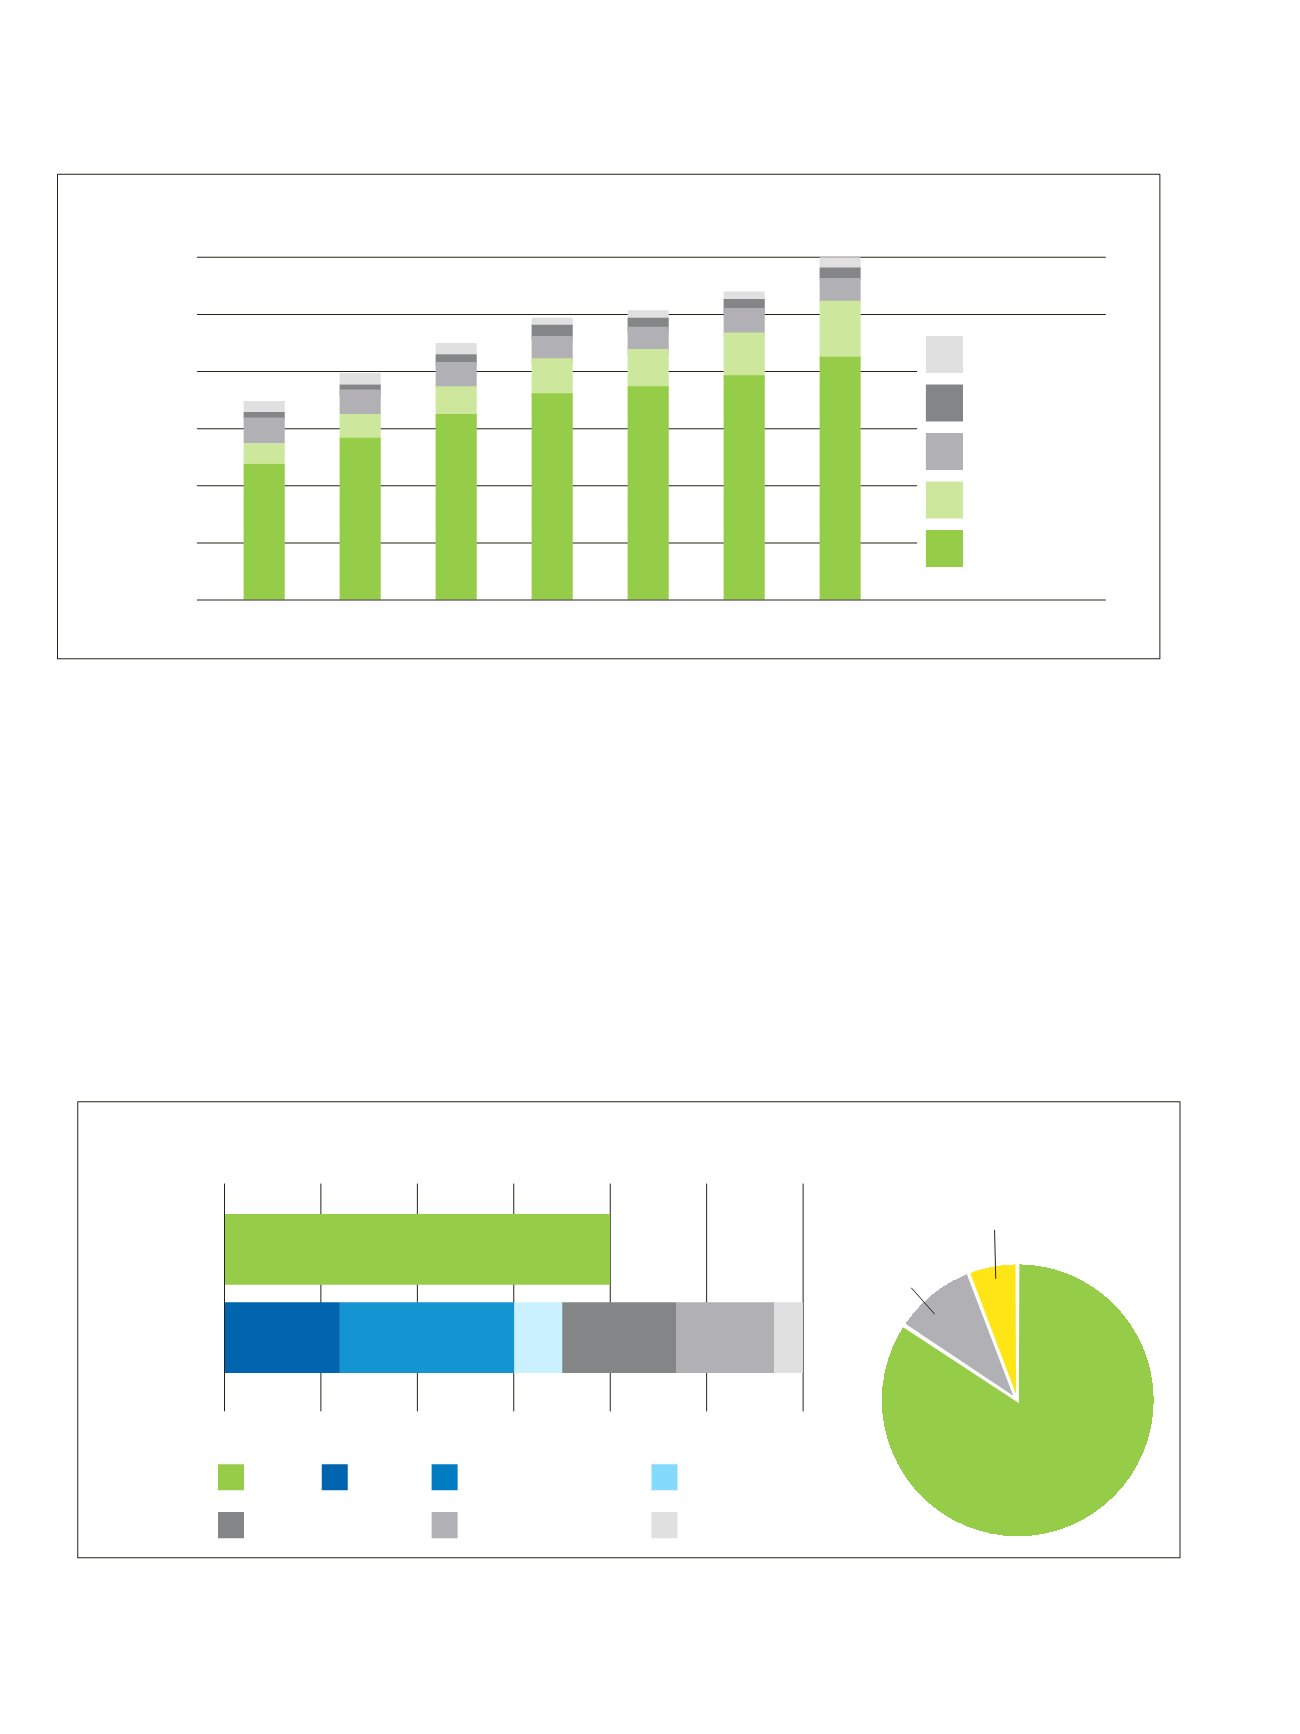
Figure 1.16
Left: Distribution of wood material in LVL production. 2,5 m
3
of logs (over bark) is needed to produce 1m
3
of LVL. Right: Weight
distribution of wood fibres, glue and moisture in ready LVL product
5
.
1.4.2 Material efficiency
The initial driver for the development of LVL has been the high
efficiency of wood raw material use. Firstly, the dimensions of
the final product are not limited by the dimensions of the raw
material – even small-diameter logs can be used to produce
long LVL beams. Secondly, the veneer structure of LVL prod-
ucts eliminates the impact of natural defects, such as knots,
resulting in a homogeneous material with excellent structural
properties. This means that logs that are not good enough for
sawing can be suitable raw material for LVL. Thirdly, products
can be manufactured to exact dimensions minimizing mate-
rial waste in cross cutting and sawing, and product features
LVL 01, F gure 1.13
0%
10%
20%
30%
40%
50%
60%
LVL
By-products
and losses
END PRODUCT, BY-PRODUCTS AND LOSSES:
SHARES OF TOTAL LOG VOLUME (%)
LVL
Bark
Green chips
Core
Dry chips & saw dust
Drying shrinkage loss
Compression loss
LVL WEIGHT DISTRIBUTION
Glue 6 %
Moisture
10 %
Wood fibers
84 %
can be varied by adjusting production process parameters. In a
modern production process about 2,5m
3
of logs (over bark) are
needed to yield 1m3 of ready LVL product, which is efficient
compared to other wood products intended for load-bearing
structures. In addition, the end product yield of LVL consists
almost exclusively of the desired product grades and sizes, un-
like sawn timber production, which produces a mixture of
heartwood and sideboards. 1 m
3
of dried sawn timber needs
about 2,0 m3 logs (over bark); the corresponding value for glu-
lam and cross-laminated timber (CLT) is 2,6-2,8m
3
.
Figure 1.15
Structural LVL production volume by market 2011 – 2017
5
.
3,0
2,5
2,0
1,5
1,0
0,5
0,0
2011
2012
2013
2014
2015
2016
2017
STRUCTURAL LVL PRODUCTION BY MARKET
Million m3 / year
Australia
Japan
New Zealand
Europe
North America
Raute Oyj
20
LVL Handbook Europe